Analysis

Metadata

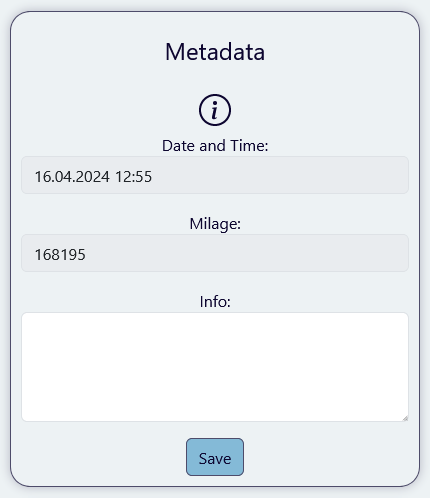
In the Metadata section of the log, you can find the timestamp and mileage, which are read directly from the log file and cannot be modified. Below, there is a text field where you can add and save notes. After making changes to the notes, press 'Save' to store them.


Saved Views

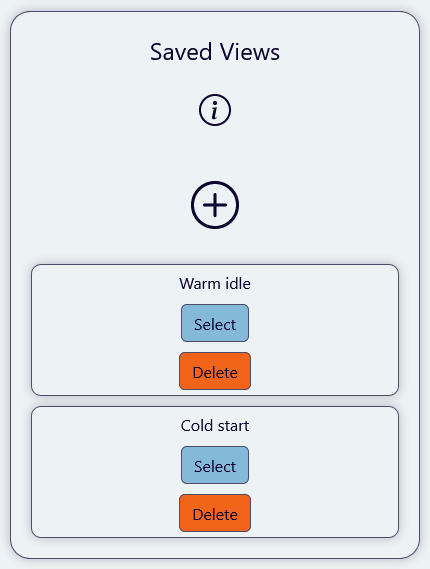
When saving a view, the current settings for x-axis zoom, the selection of secondary engine data, and the combustion mode overlay will be saved. These settings can be quickly recalled later, allowing you to efficiently navigate to or between specific, interesting parts of the log.


Mean Cylinder Effectivity
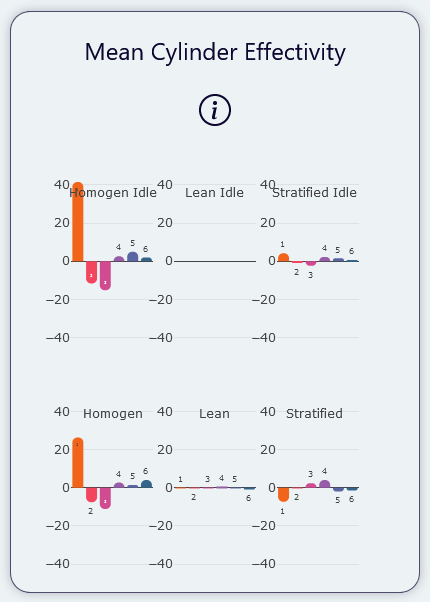
These diagrams display the average differences in combustion effectiveness for each cylinder. Positive values indicate increased combustion force from the cylinder, while negative values indicate reduced force. The upper diagrams show the efficiency during idle (when the car is stationary), while the lower diagrams show efficiency under non-idle conditions. From left to right, the diagrams represent the different combustion modes of the engine: homogeneous, lean, and stratified. When zooming in on the x-axis, only the section of the log within the zoom window will be taken into account to calculate the mean values.


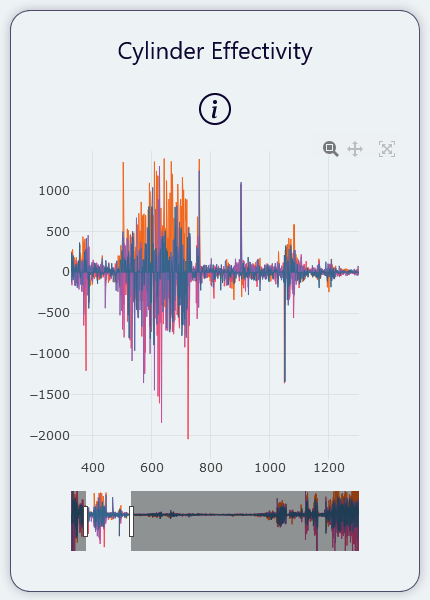
Cylinder Effectivity

This diagram shows the combustion effectivity of each cylinder. The zoom of the x-axis follows the diagram of secondary engine data and vice versa. In the top-right corner of the diagram are some controls. If the magnifying glass is active, the mouse can be used to zoome in (x and/or y), if the icon with four arrows next to the magnifying glass is active the mouse can be usd for panning around. The icon to the left resets the zoom.
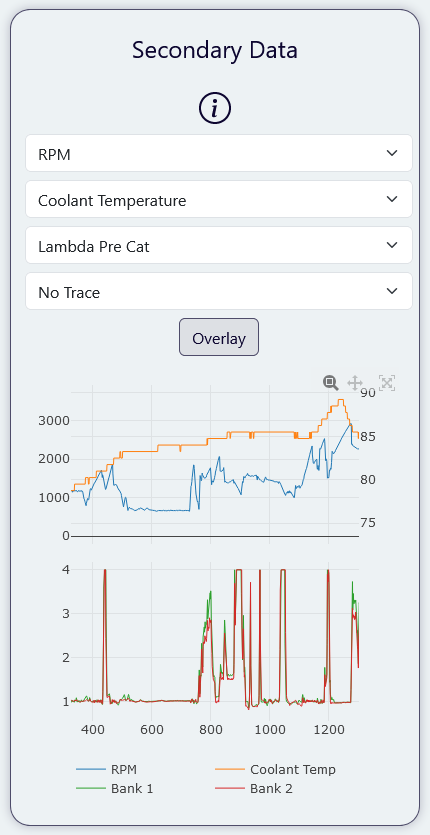
Secondary Data / Combustion Mode Overlay

Here you can inspect further engine data. The available data depends on the contents of your log file. If more than two values are selected, the diagram is split horizontally to avoid being cluttered by too many traces. By hovering over the traces you can identify the data displayed. The zoom of of the x-axis follows the Cylinder Effectivity diagram and vice versa. On the right hand top corner of the diagram are some controls. If the magnifying glass is active the mouse can be used to zoome in (x and/or y), if the icon with four arrows next to the magnifying glass is active the mouse can be usd for panning around. The icon to the left resets the zoom.
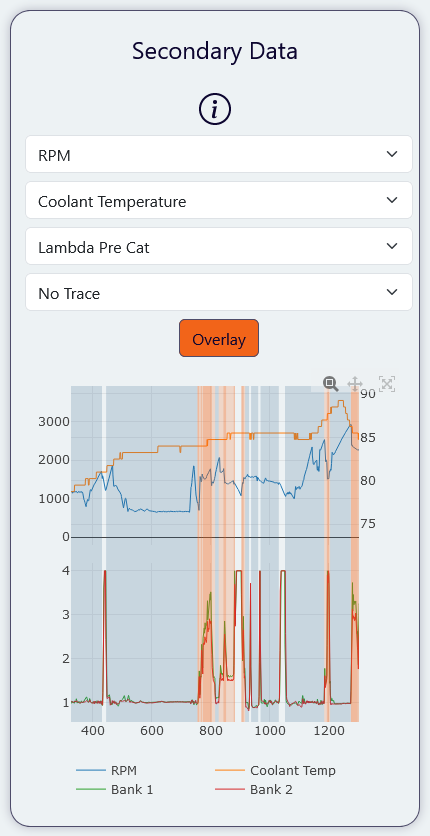
By clicking the Overlay button, a combustion mode overlay is added to the diagrams. Dark orange indicates stratified injection, light orange lean combustion and blue indicates homogenous combustion mode. No color overlay is being placed where the engine cuts off fuel during idle deceleration.